Ecommerce
How to Manage Inventory for an Online Store (Practical Guide)
TL;DR
- Run the five step loop on repeat: purchase, store, track, reorder, and count.
- Set a reorder point for every SKU: average daily sales × lead time + safety stock.
- Rank products with ABC analysis and give your A items the tightest control.
- Keep dead stock under 5% of units and review slow movers every month.
- Start in a spreadsheet and upgrade to software when errors cost more than the subscription.
A practical, numbers driven walkthrough of inventory management for online sellers, the five steps, the formulas that prevent stockouts, and the KPIs that keep cash flowing.

Learning how to manage inventory for online store success is the difference between a shop that ships on time and one that cancels orders. Get it wrong and you tie up cash in dead stock, or quietly lose customers to stockouts.
Inventory management is the system of ordering, storing, tracking, and selling the products you list online. For ecommerce sellers, who cannot physically see the shelf, it has to be deliberate.
This guide walks through the five steps, the key formulas, and the tools that keep stock accurate and cash flow healthy.
How to Manage Inventory for Online Store: The 5 Steps
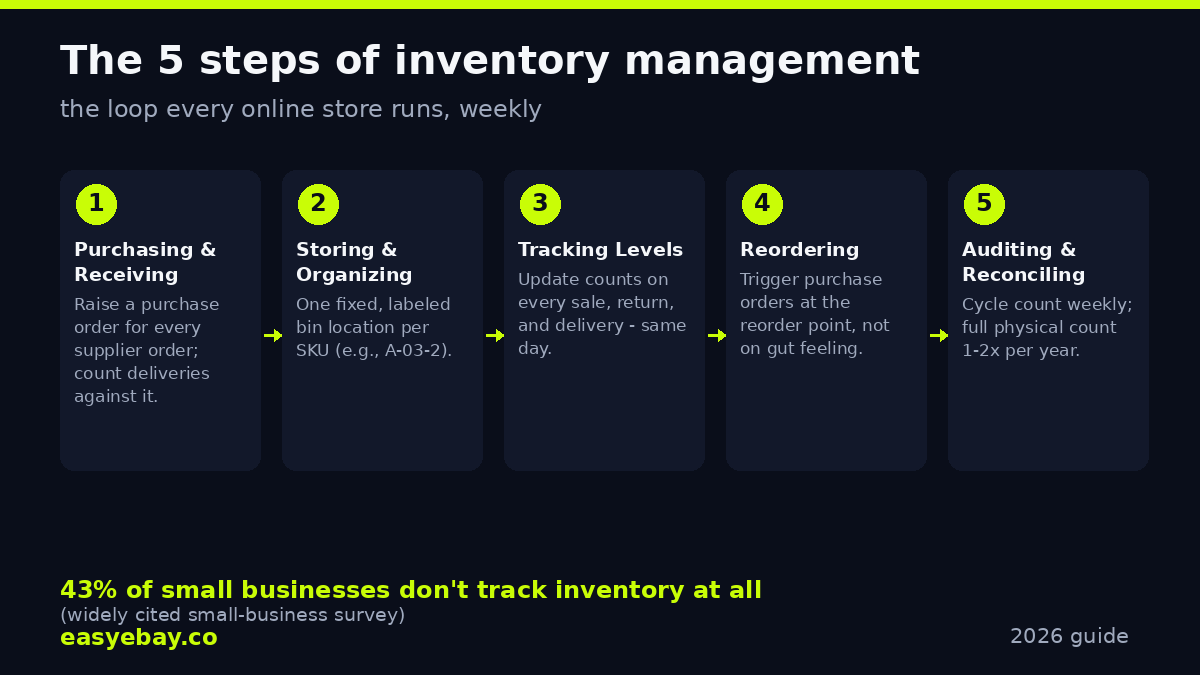
The five steps of inventory management are: (1) purchasing and receiving stock, (2) storing and organizing it, (3) tracking inventory levels in real time. Then (4) reordering before you run out using reorder points, and (5) auditing and reconciling counts against your records. Together they form a repeating loop that keeps stock accurate, shelves full, and cash flow predictable.
1. Purchasing and receiving
Every unit enters through a purchase order, even for a one person store. List SKU, quantity, price, and expected delivery date, then count the shipment against the order before shelving.
Short shipments and damage are common, and receiving is the only moment a supplier fixes them without argument.
Record actual received quantity and landed cost (price + shipping + customs + fees), landed cost, not sticker price, is what margins are built on.
2. Storing and organizing
Give every SKU a fixed, labeled home, shelf, bin, or rack, with a simple location code (e.g., A 03 2), recorded in your records.
Lookalikes differing only in size or color cause the most mispicks, so separate and clearly mark them.
Keep fast sellers at waist height near packing; slow movers higher up or further away.
3. Tracking inventory levels
Most small sellers skip this step, and it costs them most. Every sale, return, damaged unit, and delivery must update your count the same day.
A widely cited survey found 43% of small businesses don't track inventory at all, and those stores oversell most. A spreadsheet updated daily beats memory; the recorded number must match the shelf.
4. Reordering at the right time
Reordering is math, not gut feeling. Set a reorder point per SKU from sales speed and lead time, and raise it ahead of known spikes (Eid, 11.11, wedding season).
The worked example below walks through the calculation step by step.
5. Auditing and reconciling
Records drift even with perfect tracking, products get damaged, miscounted, or lost. Run full physical counts once or twice a year plus weekly cycle counts of a few SKUs.
Investigate gaps before correcting: a pattern of missing units signals a process problem; a one off gap is usually a counting error.
| Step | What you do | Key record to keep |
|---|---|---|
| 1. Purchasing & receiving | Raise purchase orders; count deliveries against them | Purchase orders, landed cost per unit |
| 2. Storing & organizing | Assign fixed, labeled locations per SKU | Bin/location code per SKU |
| 3. Tracking levels | Update counts on every sale, return, and delivery | Live stock count per SKU |
| 4. Reordering | Trigger purchase orders at reorder points | Reorder point and lead time per SKU |
| 5. Auditing & reconciling | Cycle counts weekly; full counts yearly | Count sheets and variance notes |
What Is the Reorder Point Formula?
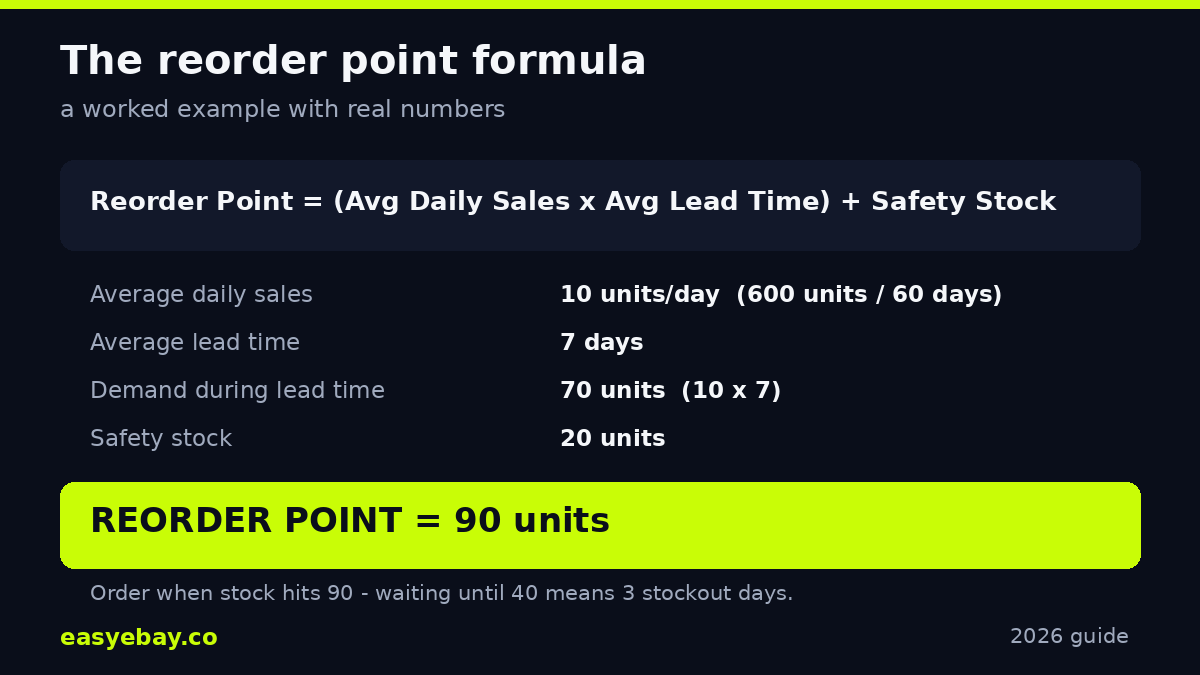
The reorder point formula is: Reorder Point = (Average Daily Sales × Average Lead Time) + Safety Stock. It gives the exact stock level that triggers a new purchase order, so replacements arrive before you sell out. Example: 10 units a day, 7 day lead time, 20 units of safety stock = reorder at 90 units.
For a deeper walkthrough of threshold based restocking, see Shopify's min max inventory guide.
This formula is the backbone of how to manage inventory for online store stock without guessing. But each input needs a real number from your records, not a guess.
Average daily sales: units sold over the last 30 to 90 days ÷ days. Use a recent window so it reflects current demand.
Average lead time: days from order placement to shelf ready stock, including customs and processing. Overseas: often 20 to 45 days; local: 3 to 7.
Safety stock: your buffer against surprises, calculated in the next section.
Worked example
Say you sell phone cases: 600 units over 60 days (10/day), 7 day lead time, 20 units of safety stock. Reorder point = (10 × 7) + 20 = 90 units, order the moment stock hits 90.
Wait until 40 and you're stockless for 3 days, and around two thirds of shoppers buy from a competitor after a stockout.
| Component | Your number | Notes |
|---|---|---|
| Average daily sales | 10 units/day | 600 units ÷ 60 days |
| Average lead time | 7 days | Order placement to shelf ready |
| Demand during lead time | 70 units | 10 × 7 |
| Safety stock | 20 units | Buffer (see next section) |
| Reorder point | 90 units | Order when stock hits this level |
What Is Safety Stock, and How Do You Calculate It?
Safety stock is buffer inventory held above expected demand to absorb surprises, supplier delays, sales spikes, shipping problems. The formula is: Safety Stock = (Maximum Daily Sales × Maximum Lead Time) minus (Average Daily Sales × Average Lead Time). It costs money to hold, so size it to your risk, not your fear.
Safety stock is a trade off: every buffer unit ties up cash. Carrying costs run roughly 20 to 30% of inventory value per year, but stockouts cost more, lost sales today, plus customers who never return.
The formula sizes the buffer from your actual variability: worst case versus average case.
Worked example
Using the same phone cases: maximum daily sales of 18 units, maximum lead time of 12 days, against averages of 10 units and 7 days.
Safety stock = (18 × 12) minus (10 × 7) = 216 minus 70 = 146 units.
That's a big buffer, it reflects genuinely volatile demand and delivery. If it ties up too much cash: switch to a more reliable supplier, cap spike causing promotions, or accept slightly higher stockout risk on this SKU.
Never zero it out, on your top 20% of products, a stockout hurts far more than the buffer's cost.
What Is ABC Analysis in Inventory Management?
ABC analysis ranks products into three categories by value. A items, roughly 20% of products generating about 80% of revenue, get the tightest control. B items get moderate oversight; C items, the low value long tail, get simple rules. It tells you exactly where to focus counting, forecasting, and safety stock.
For a practical framework on segmenting stock by value and velocity, see Shopify's inventory segmentation guide.
In almost every store, a small slice of SKUs drives most revenue. List every SKU with annual revenue (units × price) and sort highest to lowest.
Mark the group reaching ~80% of total revenue as A, the next ~15% as B, the rest as C.
| Category | Share of SKUs | Share of revenue | How to manage it |
|---|---|---|---|
| A, top value | ~20% | ~80% | Tightest control: weekly cycle counts, accurate forecasts, proper safety stock, reliable suppliers |
| B, middle value | ~30% | ~15% | Moderate control: monthly counts, standard reorder points, review quarterly |
| C, low value | ~50% | ~5% | Simple rules: order in bulk twice a year, count annually, don't overthink it |
The payoff: A items get weekly counts and careful forecasts; C items get bulk ordered and ignored. Re run every six months, today's C item can go viral.
FIFO vs LIFO vs Weighted Average: Which Inventory Method Should You Use?
FIFO (first in, first out), LIFO (last in, first out), and weighted average are methods for valuing inventory and calculating cost of goods sold. FIFO assumes oldest stock sells first, the most common choice for online sellers. Weighted average smooths price swings. LIFO is banned under IFRS, which Pakistan follows. Your choice affects reported profit and tax.
They matter when you buy the same product at different prices. Buy 100 units at $5, later 100 at $7, which cost goes to the units sold?
It changes reported profit and, often, your tax bill.
| Method | How it works | Best for | Watch out |
|---|---|---|---|
| FIFO (first in, first out) | Oldest units are treated as sold first | Perishables, fashion, electronics, anything where old stock loses value; the default for most online sellers | In rising price markets it reports higher profit (and higher tax) |
| Weighted average | Every unit is valued at the average cost of all units on hand | Stores with frequent small restocks at varying prices; simplest to maintain in a spreadsheet | Hides price trends, you won't see supplier costs creeping up |
| LIFO (last in, first out) | Newest units are treated as sold first | Rarely used in ecommerce; banned under IFRS, which Pakistan follows | Creates outdated inventory values on the balance sheet; avoid unless your accountant insists |
For most online sellers, FIFO is the right default: oldest stock moves first, values stay current, and it complies with IFRS.
Weighted average suits constant small restocks at varying prices. Apply your choice consistently, switching yearly to flatter numbers won't survive an audit.
Can I Use Excel for Inventory Management?
Yes, Excel or Google Sheets works for inventory management under roughly 100 SKUs on one channel: the formulas are simple and the cost is zero. Spreadsheets break down with multiple channels, staff, or fast moving stock, where a dedicated tool updates counts automatically. Start with a sheet; upgrade when errors cost more than software.
A practical way to learn how to manage inventory for online store operations is to build the spreadsheet yourself first. The formulas teach the logic, so you understand later software and spot when it's wrong.
One row per SKU: SKU, name, bin location, current stock, daily sales, lead time days, safety stock, reorder point (formula), supplier, last counted date.
| Factor | Spreadsheet (Excel / Google Sheets) | Inventory software |
|---|---|---|
| Cost | Free | Monthly subscription |
| SKU capacity | Comfortable up to ~100 SKUs | Thousands of SKUs |
| Sales channels | One channel; you update counts manually | Multi channel sync (website, marketplace, social) updates automatically |
| Error risk | High, one wrong formula or missed update corrupts everything | Low, barcode scanning and automatic deductions |
| Team use | Messy with 2+ people editing | Built for teams with roles and audit trails |
| Forecasting | Manual formulas you build yourself | Automatic demand forecasting from sales history |
| When to switch | Not applicable | Switch when oversells, stockouts, or counting time cost more than the subscription |
Upgrade on pain, not SKU count: two oversells in a quarter, month end counts eating a weekend, or a second sales channel.
Until then, a disciplined spreadsheet beats expensive software nobody updates.
What Are the KPIs for Inventory Control?
The KPIs that matter for inventory control are inventory turnover, days of inventory on hand, sell through rate, and stockout rate. Also track carrying cost of inventory, order accuracy, and dead stock percentage. Each has a simple formula and a healthy range. For example, most healthy online stores turn inventory 4 to 6 times per year and keep dead stock under 5% of total units.
KPIs turn how to manage inventory for online store performance from guesswork into a dashboard. Start with turnover, stockout rate, and dead stock, add the rest later.
| KPI | Formula | Healthy range |
|---|---|---|
| Inventory turnover | Cost of goods sold ÷ average inventory value | 4 to 6 per year for most online stores |
| Days of inventory on hand | 365 ÷ inventory turnover | 60 to 90 days; lower is leaner |
| Sell through rate | Units sold ÷ units received (per period) | 80%+ per season for healthy SKUs |
| Stockout rate | Stockout incidents ÷ total SKU days | Under 2% for A items |
| Carrying cost of inventory | (Storage + insurance + shrinkage + capital cost) ÷ average inventory value | Roughly 20 to 30% per year (rule of thumb) |
| Order accuracy | Orders shipped without error ÷ total orders | 98%+ |
| Dead stock percentage | Units unsold for 12+ months ÷ total units | Under 5% |
Dead stock is frozen cash, mark it down, bundle it, or clear it.
Carrying cost justifies every other KPI: at roughly 20 to 30% per year, $10,000 of slow stock costs $2,000, $3,000 a year just to own.
What Is a Good Ratio of Inventory to Sales?
A good inventory to sales ratio is roughly 1:4 to 1:6 per year, a turnover of 4 to 6. That means you sell through average stock 4 to 6 times annually. Ratios vary by niche: fast fashion turns faster, furniture slower. The trend matters most: a falling ratio with steady sales means cash is getting trapped on the shelf.
Compute it as annual cost of goods sold ÷ average inventory value. A ratio of 5 is healthy; 1.5 means stock sits eight months, frozen cash.
A sliding ratio with steady sales means over ordering or too many C items: fix with clearance pricing and smaller, more frequent orders.
How to Improve Your Inventory Management: 8 Best Practices
To improve inventory management: (1) set reorder points for every SKU, (2) cycle count high value items weekly. (3) Keep one master record, (4) forecast from your sales history, (5) build supplier backups. (6) Review dead stock monthly, (7) standardize SKUs and barcodes, (8) track KPIs and act on them. Start with 1 to 3; they fix most stockouts.
1. Set a reorder point for every SKU. Even a rough reorder point beats "I think we're running low."
2. Cycle count A items weekly. A small weekly rotation beats one exhausting annual count, catch drift early, when it's cheap to fix.
3. Keep one master record. One spreadsheet or one system holds the truth, the moment numbers live in two places, they disagree and you trust neither.
4. Forecast from your own history. Your last 90 days predict the next 90 better than any industry report. Add seasonal bumps (Eid, 11.11, Black Friday) from last year's lift.
5. Keep a backup supplier for A items. One supplier is a single point of failure, qualify an alternative so delays become inconveniences, not stockouts.
6. Review dead stock monthly. Unsold 6+ months goes on a watchlist; at 12 months mark it down, bundle it, or clear it. Dead stock silently kills small store cash flow.
7. Standardize SKUs and barcodes. One SKU format (e.g., CAT COLOR SIZE) across channels, printed as barcodes on bins. Mispicks drop the week you do this.
8. Track KPIs and act on them. Pick three, turnover, stockout rate, dead stock, review monthly, and change one thing each month. Measurement without action is paperwork.
7 Common Mistakes That Wreck Online Store Inventory
The most damaging inventory mistakes are tracking stock in your head, ignoring landed cost, and reordering fixed quantities regardless of demand. Others: no safety stock on bestsellers, treating all SKUs equally, letting returns bypass the system, and never counting. Each drains cash or causes stockouts, all seven are fixed by the five step loop.
1. Tracking stock in your head. Memory is not a system, the store that "just knows" its stock oversells during the next sale.
2. Ignoring landed cost. Forgetting shipping, customs, and packaging when pricing erases your margin. Always cost from landed cost.
3. Ordering the same quantity every time. Fixed quantity reorders ignore seasonality and growth. Recalculate reorder points quarterly.
4. No safety stock on bestsellers. A items deserve a buffer, zero safety stock on your top seller is a stockout waiting for a supplier delay.
5. Treating all SKUs equally. Counting a $2 accessory like a $200 flagship wastes time where it matters least. That's what ABC analysis prevents.
6. Letting returns bypass the system. Online return rates commonly run around 20 to 30%, far above in store. Every return must reenter your count the day it arrives, or records inflate.
7. Never counting. Skipping audits because "the spreadsheet says we're fine" is how 50 unit gaps are discovered a year later. Cycle count weekly; the habit is the system.
Frequently Asked Questions
Quick answers to common questions about how to manage store inventory step by step. The five steps form a loop of buying, storing, tracking, reordering, and counting.
Reorder with (Daily Sales × Lead Time) + Safety Stock; rank products with ABC analysis. Track turnover, stockout rate, and dead stock; start in a spreadsheet until errors cost more than software.
What are the 5 steps of inventory management?
Purchasing and receiving, storing and organizing, tracking inventory levels, reordering at the right time, and auditing and reconciling.
They form a loop: stock enters, gets stored, tracked, reordered before it runs out, and counted to keep records honest.
What is the reorder point formula?
Reorder Point = (Average Daily Sales × Average Lead Time in Days) + Safety Stock. Example: 10 units sold per day × 7 day lead time + 20 units of safety stock = reorder at 90 units.
Place the next purchase order the moment stock hits that level.
What is safety stock?
Buffer inventory held above expected demand to absorb supplier delays and demand spikes. Formula: (Maximum Daily Sales × Maximum Lead Time) minus (Average Daily Sales × Average Lead Time).
It costs roughly 20 to 30% of its value per year to carry, so size it to real variability.
What is ABC analysis in inventory management?
It sorts products by revenue. A items (~20% of SKUs, ~80% of revenue) get the tightest control and weekly counts. B items get standard reorder points; C items (the low value long tail) get bulk ordering and minimal attention.
What is a good ratio of inventory to sales?
Roughly 1:4 to 1:6 per year, an inventory turnover of 4 to 6. Divide annual cost of goods sold by average inventory value.
Below 3 usually means cash is trapped in slow stock; far above 8 can mean chronic stockouts from under ordering.
Can I use Excel for inventory management?
Yes, up to roughly 100 SKUs on one channel. Build one row per SKU with stock count, daily sales rate, lead time, safety stock, and a reorder point formula.
Upgrade when oversells, multi channel selling, or counting time start costing real money.
What is KPI for inventory control?
The essential inventory KPIs are inventory turnover (target 4 to 6 per year), stockout rate (under 2% for A items), and dead stock percentage (under 5%).
Also track sell through rate (80%+ per season), order accuracy (98%+), and carrying cost (roughly 20 to 30% of inventory value per year).
How can I improve my inventory management quickly?
The fastest way to learn how to manage inventory for online store success: start with a spreadsheet and set a reorder point for every SKU. Update counts daily, and cycle count top sellers weekly.
Those four habits solve most stockouts and oversells, software can come later, once the discipline is in place.
Mastering how to manage inventory for online store growth isn't expensive software. It's a disciplined loop of ordering, tracking, reordering, and counting, guided by a few honest numbers.
Start with the five steps, add the reorder point formula, and let the KPIs tell you what to fix next.
Further Reading
Free Download
Payoneer And eBay Setup Checklist
24 simple steps to open, verify and link your accounts the right way. Free PDF, made by Asad.
Want Help With Your Store?
Book a free call with Asad Shahzad.
Book A Free Call
Asad Shahzad | Founder and Mentor
Asad Shahzad is the Co Founder and Co Mentor of EasyEbay. He helps store owners manage accounts and grow sales.
Read more from Asad ShahzadRelated Topics
How Much Can You Earn in Pakistan from Walmart, Temu, Shopify, TikTok Shop and Vinted?
There is no fixed monthly income on Walmart, Temu, Shopify, TikTok Shop or Vinted, and from Pakistan some of these platforms are not even open to you yet. This guide shows what your earnings really depend on, how to estimate an honest number for yourself, and why big sales screenshots prove so little.
How to Handle Customer Messages Like a Pro (With Reply Templates)
Learn how to handle customer messages on eBay, Amazon, Etsy and other marketplaces with simple rules, a daily routine, and polite reply templates you can copy.
Daraz vs eBay, Amazon and Other Marketplaces: Where Should Pakistani Sellers Sell?
Is eBay better than Daraz for Pakistani sellers? An honest comparison of Daraz, eBay, Amazon, Walmart, Etsy, Shopify, TikTok Shop, Temu and Vinted, covering buyers, fees, payments and who can join.